Respect time
Preprocessing and coefficients use earlier years at every forecast origin. Tune on an earlier block, then evaluate the procedure on later years.
Interpretable regional models that connect monthly weather to crop yield, compare methods chronologically, and explain their predictions.
R ≥ 4.2 · Standard-library model estimation · MIT code
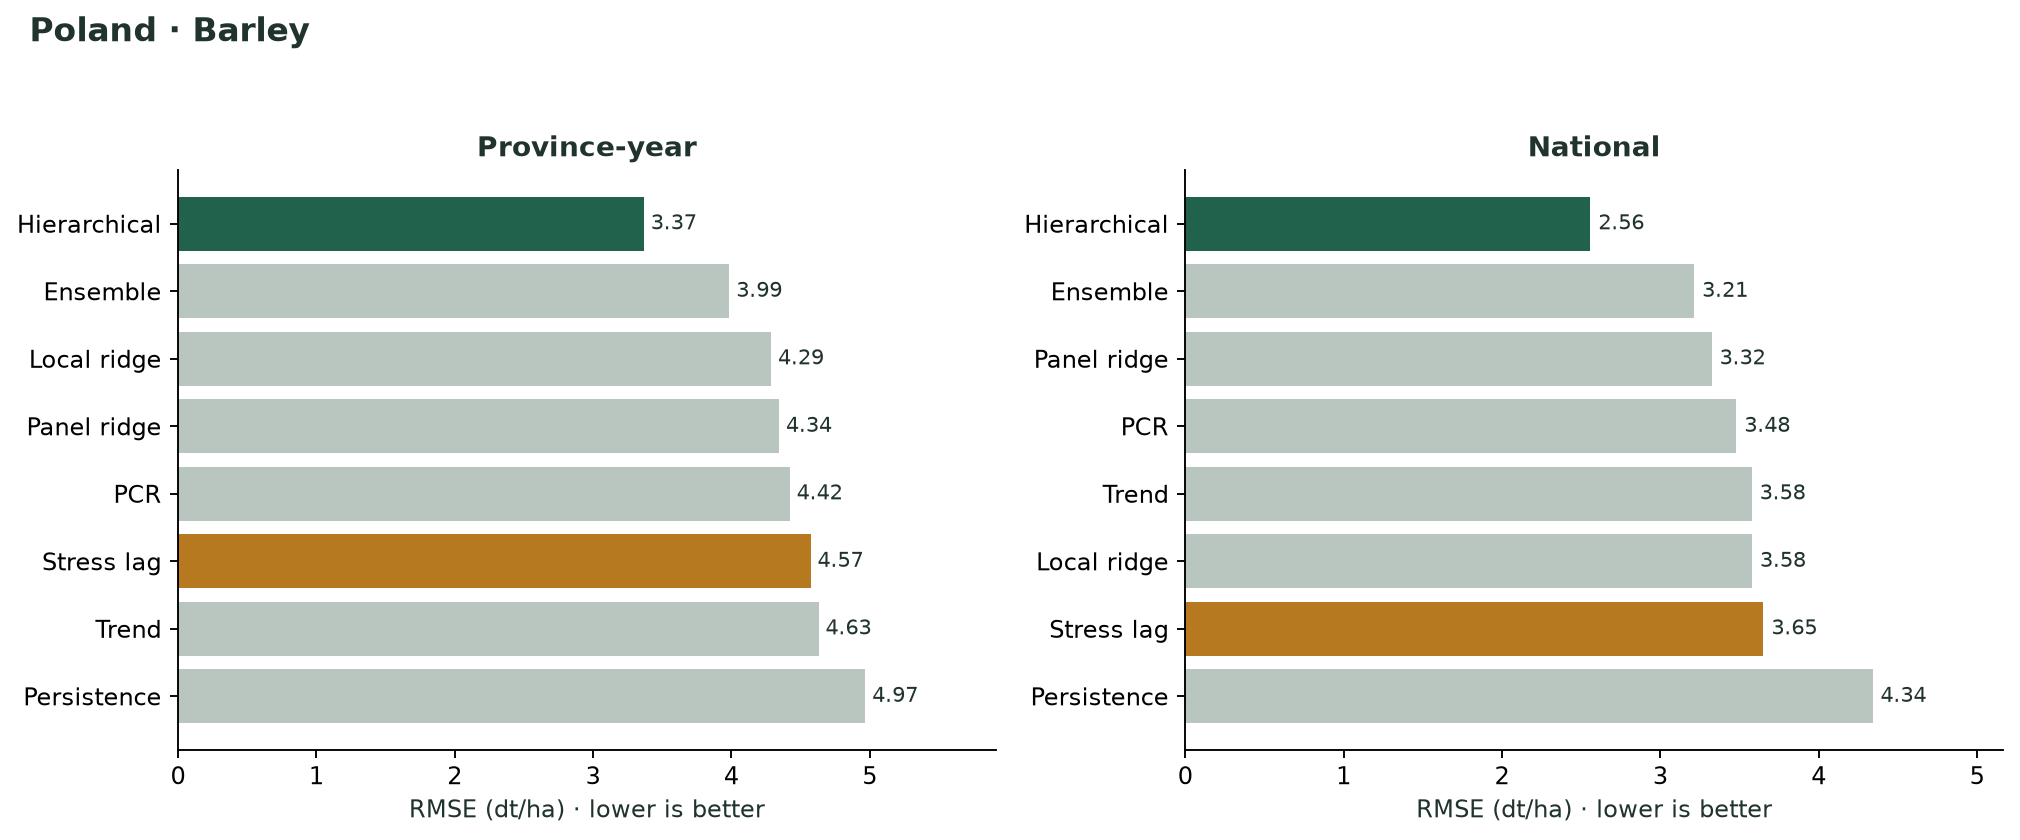
Eight estimators. The same evaluation years.
Every score comes from the bundled Poland example.
A complete statistical workflow: data preparation, model tuning, rolling evaluation, fitting, prediction, and result export.
Preprocessing and coefficients use earlier years at every forecast origin. Tune on an earlier block, then evaluate the procedure on later years.
Compare pooled and regional effects, smooth monthly coefficients, asymmetric weather anomalies, and compound hot–dry interactions.
Break a stress-lag prediction into additive components. Diagnose weather extrapolation, empirical intervals, and regional errors.
Use bundled inputs or provide your own region/year panel. A comparison object retains tuning candidates, selected settings, row-level predictions, model objects, and diagnostics.
Explore the function reference →install.packages("remotes")
remotes::install_github("MR-Eini/yieldlag",
ref = "v0.3.0")
library(yieldlag)
data <- read_crop_data(
poland_example_path(), "barley", 6
)
config <- crop_model_config(
stress_temperature = "MAX",
stress_precipitation = "PCP"
)
result <- compare_crop_models(
data, config, 2018, 2019
)Barley and wheat across 16 provinces. Explore predictions, evaluation metrics, seasonal coefficients, regional differences, and the exported tables.